| Population Distribution comparison between Year 2000 and 2010 by Race | |
|---|---|
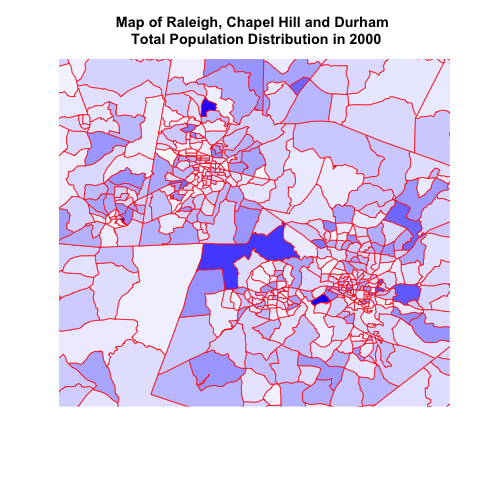  |
Image 1: Map of Raleigh, Chapel Hill and Durham on Total Population Distribution in 2000 and 2010 |
|
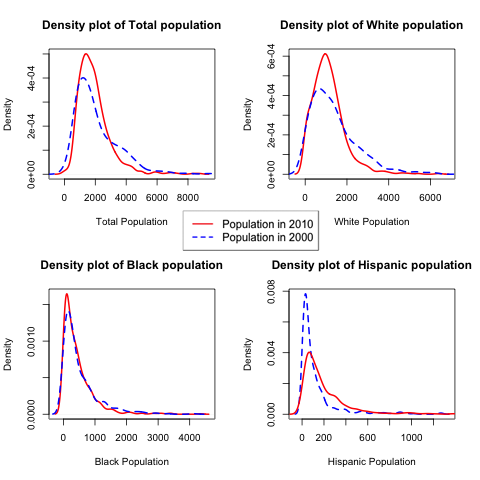
Image 2: Density Estimation of Population by Race in 2000 and 2010 |
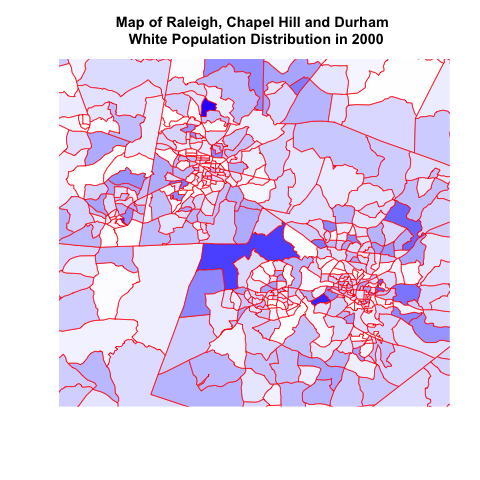  |
Image 3: Map of Raleigh, Chapel Hill and Durham on White Population Distribution in 2000 and 2010 |
  |
Image 4: Map of Raleigh, Chapel Hill and Durham on Black Population Distribution in 2000 and 2010 |
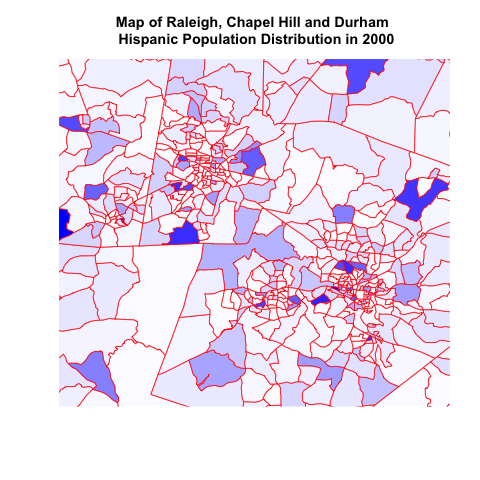  |
Image 5: Map of Raleigh, Chapel Hill and Durham on Hispanic Population Distribution in 2000 and 2010 |
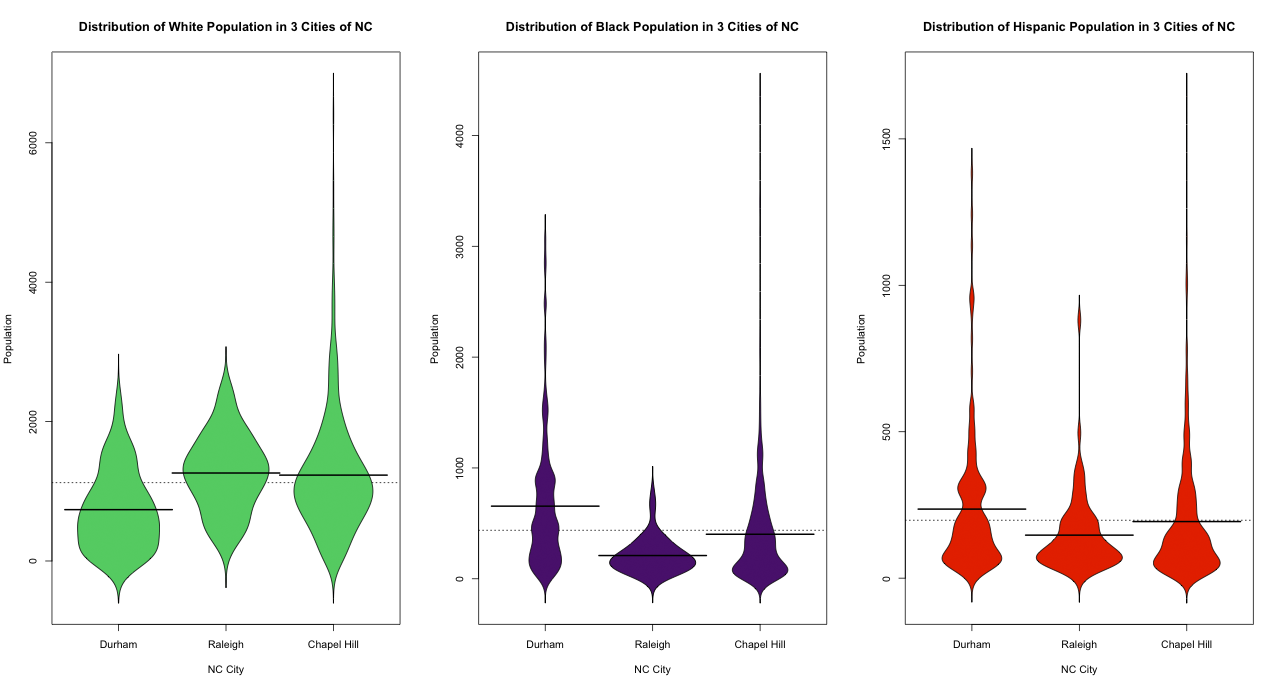 |
Image 6: Comparison of distributions of Population by Race by Cities |
| Relationships between Age, Income and Population Distribution and Race | |
|
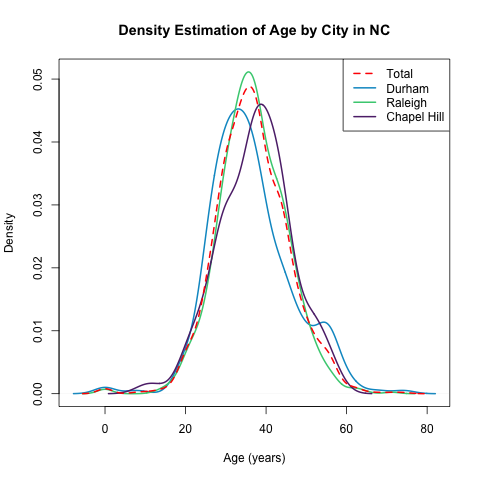
Image 7: Density Estimation of Income and Age by Cities |
|
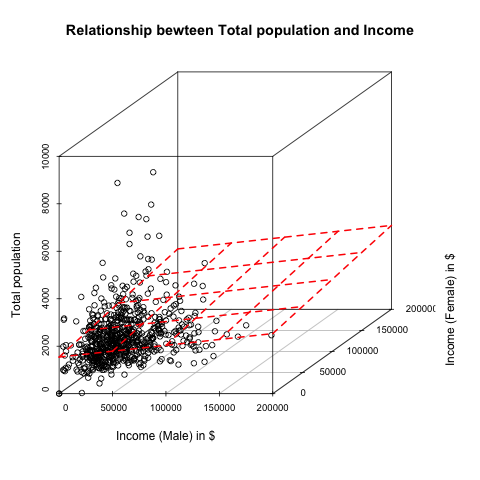
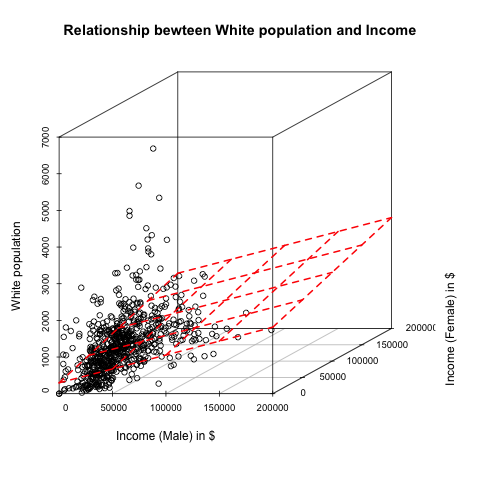
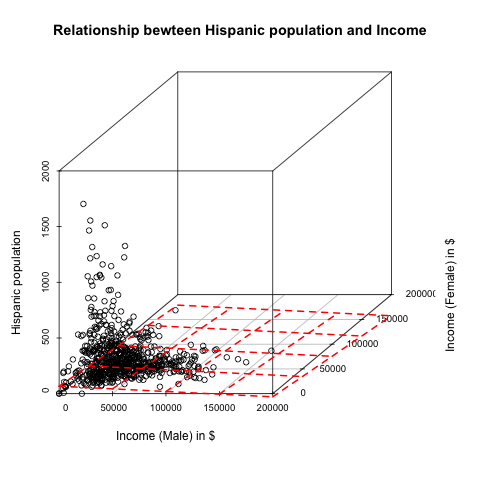
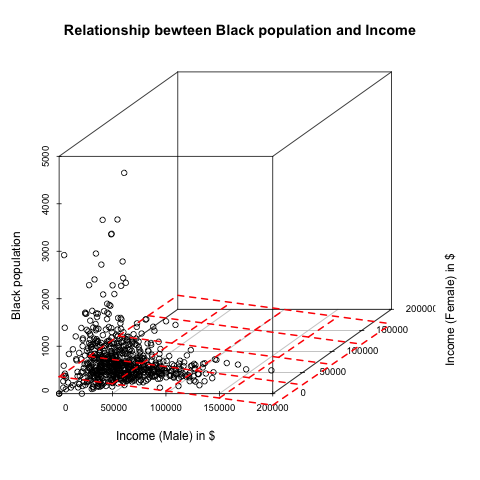
Image 8: Relationships between Income and Population by Race |
 |
Image 9: Relationships between Income and Race by Age |
|
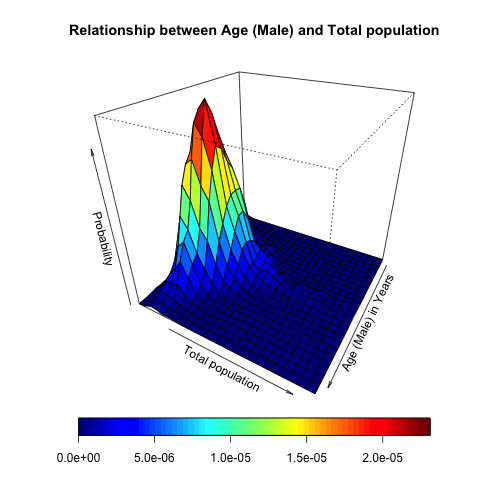
Image 10: Relationships between Age (Male) and Population by Race |